Note: This version includes GAPP (GEWEX Americas Prediction Project) instead of GCIP (GEWEX Continental-scale International Project). In other aspect this version is the same as version 0.12.
We want to know the global energy and water cycle quantitatively. So the Global Energy and Water Cycle Experiment (GEWEX) is conducted. GEWEX has components to produce global data products to be used in the evaluation. They have to heavily rely, however, on either satellite remote sensing or numerical prediction models, in large parts of the world. We can more directly observe some terms of water and energy balance in limited area and/or time span. Thus, Continental-Scale Experiments (CSEs) are conducted in the framework of GEWEX. With data obtained by CSEs, we can evaluate and hopefully improve the water and energy budgets obtained with global data products. This is the subject of the Water and Energy Balance Study (WEBS) component of GEWEX.
In the context of GEWEX, many acronyms are used. For full spelling of those which I miss to mention, please consult the WWW page of GEWEX (http://www.gewex.org/) and of GAME (http://www.hyarc.nagoya-u.ac.jp/game/).
The simplest way of this evaluation is to compare values of the same variable at the same temporal and spatial target. In the first initiative of GEWEX WEBS, the variables are the terms appearing the vertically-integrated budget equations of water and energy. The target in time is any of the calendar months between July 1996 and June 2001. The target in space may be the average of each CSE region, though distribution within a CSE region may be sometimes discussed. For effective comparison, working definition of the extent of CSE regions is needed.
I am in charge of WEBS in GAME (GEWEX Asian Monsoon Experiment), one of CSEs. For this purpose, I have made a tentative version of a template of GAME regions. For purpose of comparison, I also included other CSE regions.
The template uses 1-degree latitude-longitude grid boxes. It is based on the river routing data set "TRIP" (Oki T. and Sud Y., 1998, Design of Total Runoff Integrating Pathways (TRIP) --A global river channel network. Earth Interactions, Vol. 2, Paper 1.). The area for GAME Tibet is not based on TRIP but on elevation data (see document in the "Tibet/map" section in the table below). Oki and his collaborators have made a 0.5 degree version of TRIP, and I consider making a template at that resolution (though I have not decided yet to do so).

Here is an ASCII file with blank-separated three columns:
("wbts" and "wbts_jra" stand for water balance time series, to be described below.)
| code number | experiment | river | map | wbts | wbts_jra |
|---|---|---|---|---|---|
| 1 | MAGS | Mackenzie | map | wbts | wbts_jra |
| 2 | GAPP | (USA 48 states) | map | wbts | wbts_jra |
| 3 | LBA | Amazon | map | wbts | wbts_jra |
| 4 | BALTEX | (Baltic Sea) | map | wbts | wbts_jra |
| 5 | GAME Siberia | Lena | map | wbts | wbts_jra |
| 6 | GAME Tibet | (Tibetan Plateau) | map | wbts | wbts_jra |
| 7 | GAME HUBEX | Huai He | map | wbts | wbts_jra |
| 8 | GAME Tropics | Chao Phraya | map | wbts | wbts_jra |
| 9 | MDB | Murray-Darling | map | wbts | wbts_jra |
| 10 | LPB | La Plata | map | wbts | wbts_jra |
| 11 | AMMA/CATCH | (West Africa) | map | wbts | wbts_jra |
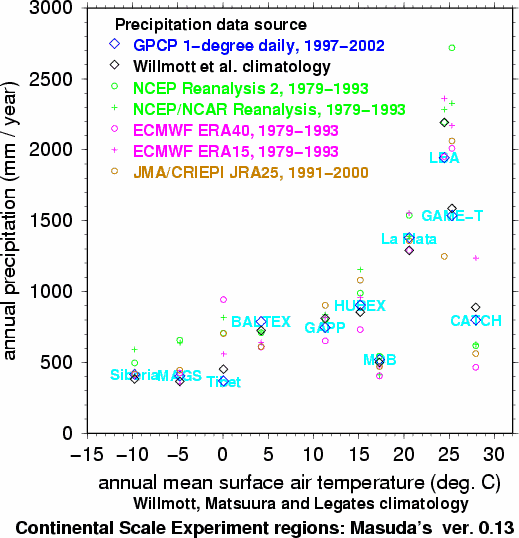
Climatological annual mean surface air temperature and annual precipitation
are shown.
For temperature, climatological data based on surface observations,
compiled by Willmott, Matsuura and Legates (University of Delaware;
see http://climate.geog.udel.edu)
taking account of land surface elevation is used.
For precipitation, Willmott et al.'s climatological data with gauge correction are shown along with several global products.

Note that NCEP Reanalysis 2 (6 hour forecast) overestimates precipitation in GAME-T region very much compared with observational data (GPCP and Willmott). Actual precipitation of GAME-T region is smaller than LBA region. It does not mean that the precipitation is weaker in Southeast Asia than in Amazonia, but (probably) that it is weaker in the GAME-T region than in the average of Southeast Asia. Also, NCEP Reanalysis 2 as well as NCEP/NCAR Reanalysis overestimate precipitation in cold regions (MAGS and Siberia).
For preliminary evaluation of global data products,
monthly, area averaged values of the terms in the equation of
water balance are shown as graphs in the "wbts" and "wbts_jra"
entries in the above table.
JRA25
(Japanese reanalysis by JMA and CRIEPI, see http://jra.kishou.go.jp/)
and
GAME Reanalysis
(an experimental project at MRI, see http://gain-hub.mri-jma.go.jp/GAME_reanalysis.html)
are included, but only in the graphs of "wbts_jra".
The water balance considered here is that of vertically integrated water vapor in the atmosphere (W):
dW/dt = -(P - E - C).
where P is precipitation, E is evaporation and C is convergence of vertically integrated horizontal transport of water vapor.
The data source is as follows: