This page is a display of work in progress.
It may be changed without notice.
| (Part 1) Population density at each census;
Increase rate at each interval between censuses |
| C.E. | Japanese year | Pop. density (person / km2) | Info source | Note (based on Hayami 1992) |
Increase rate (%/year) | Note (my guess) |
|---|
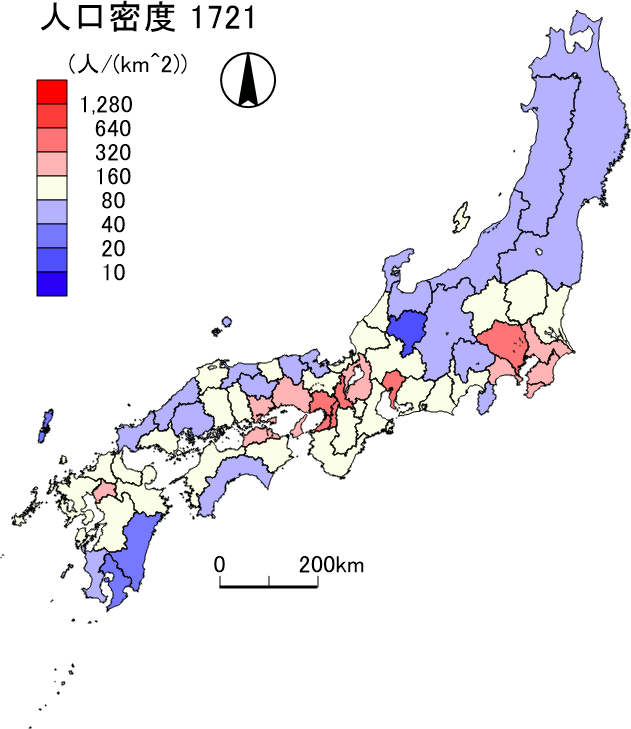
| 1721 | Kyôhô 6 |
 |
a | | | |
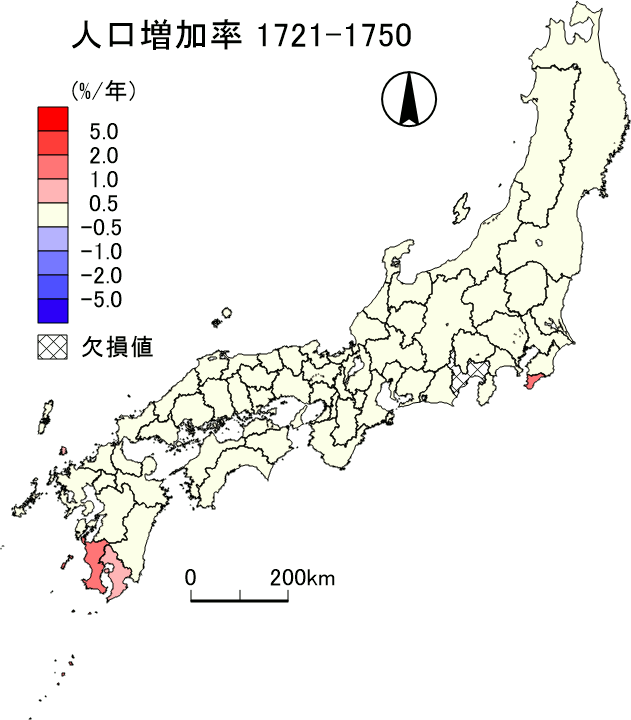
| 1750 | Kan'en 3 |
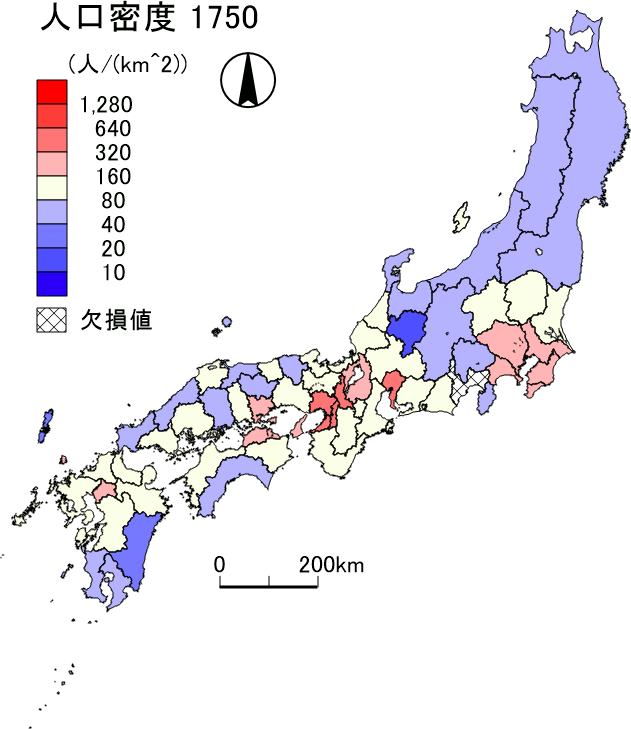 |
a | Excluded (too large): Suruga |
 |
|
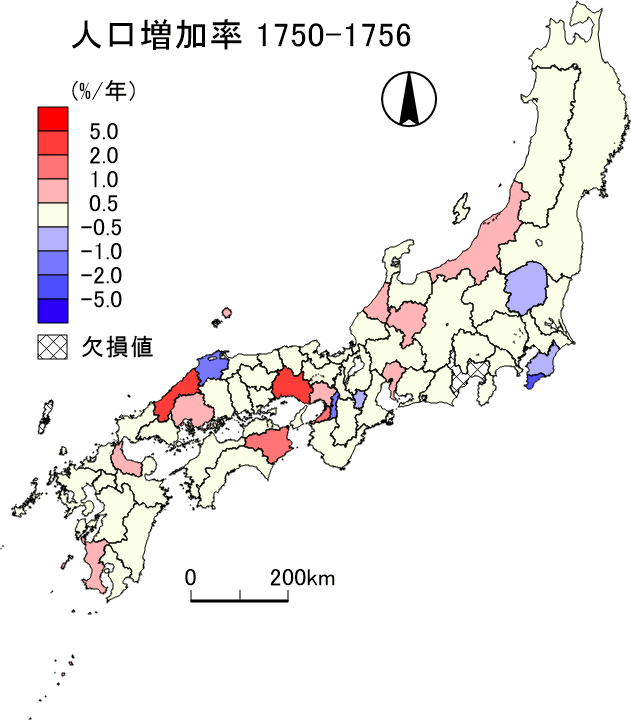
| 1756 | Hôreki 6 |
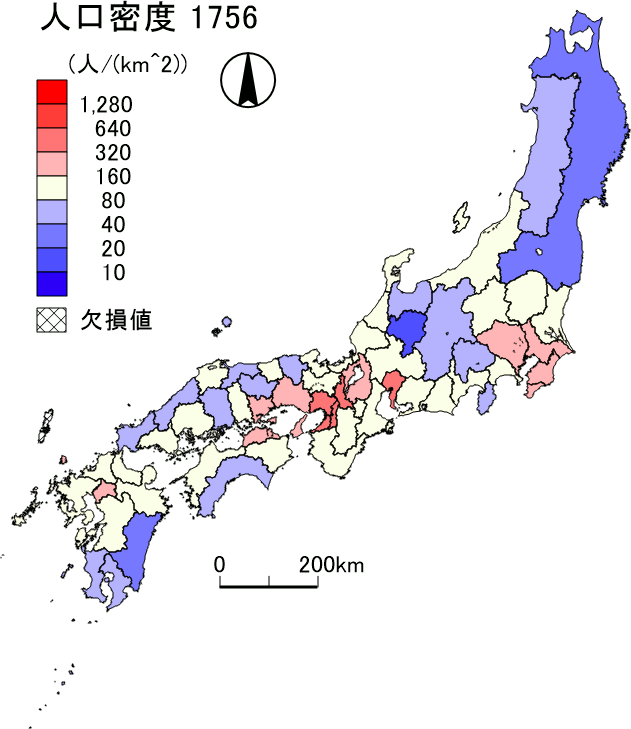 |
a | Excluded (too small): Tsushima
Exchanged: Noto & Kaga |
 |
|
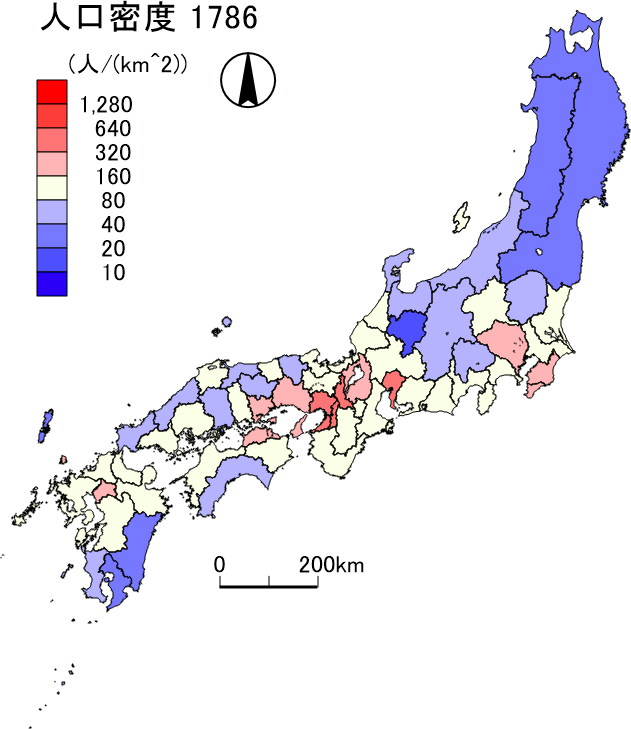
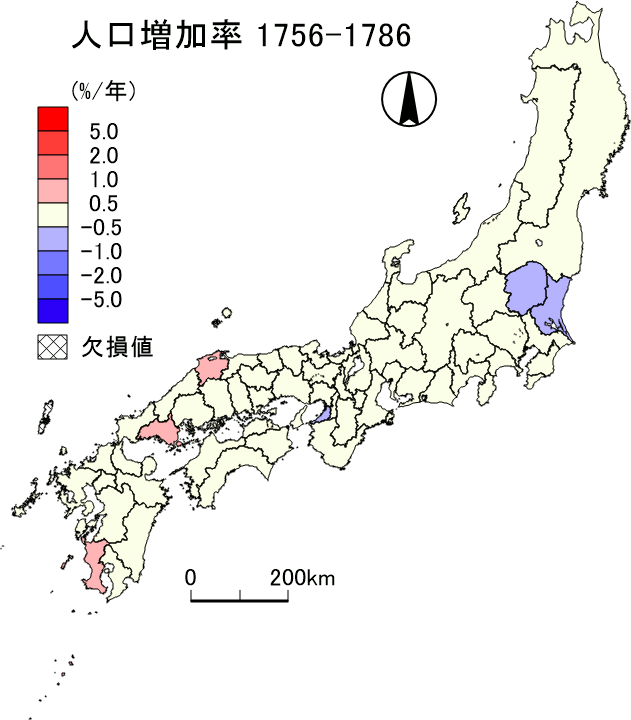
| 1786 | Tenmei 6 |
 |
b | |
 |
|
| 1792 | Kansei 4 |
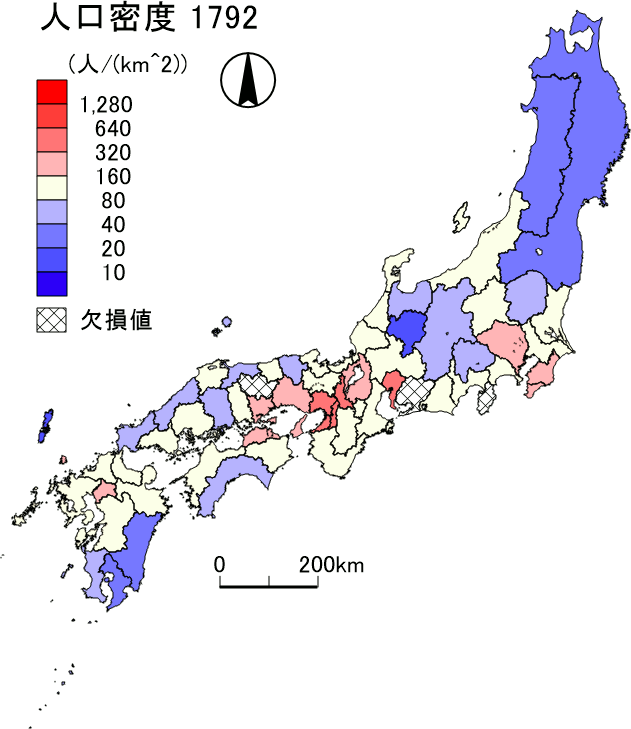 |
c | Excluded (too small): Izu, Mikawa, Mimasaka |
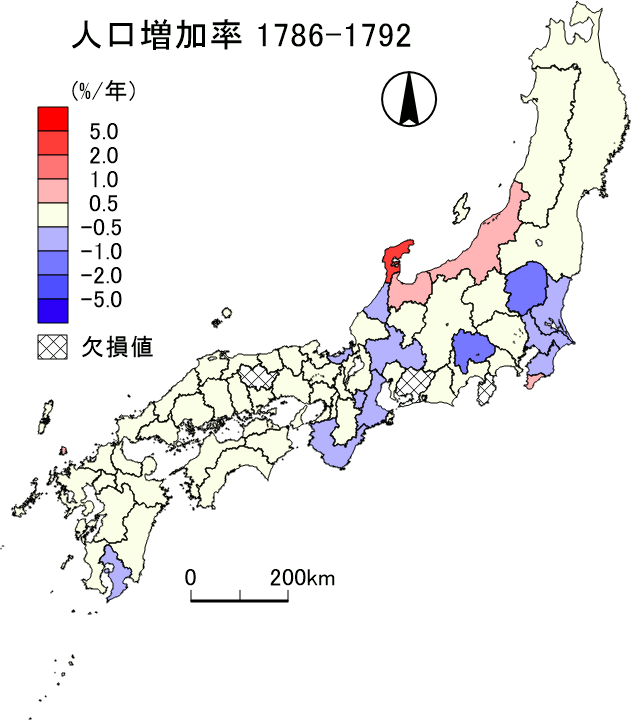 |
Possibly too small: Kai |
| 1798 | Kansei 10 |
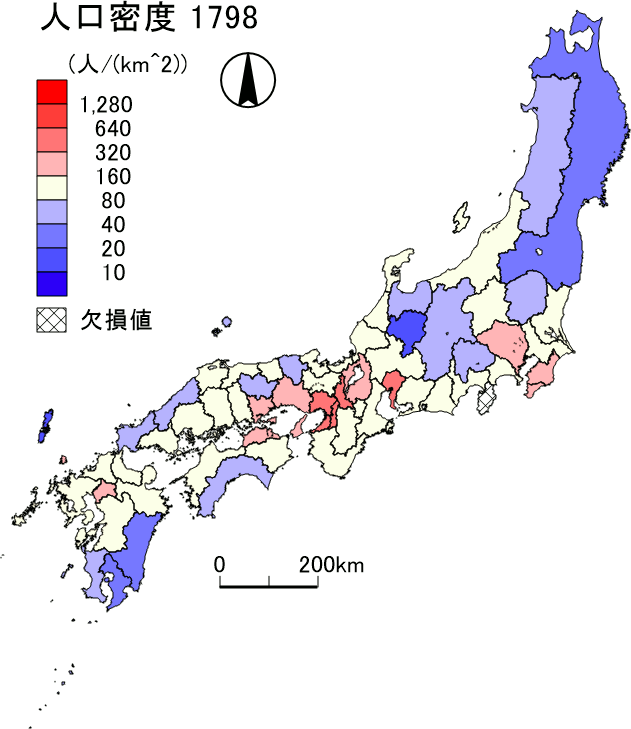 |
b | Excluded (too small): Izu |
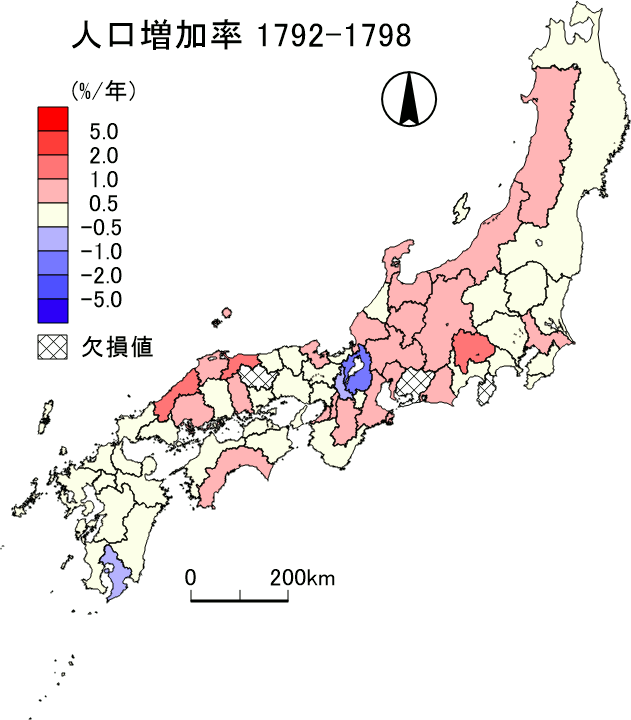 |
Possibly too large: Kai |
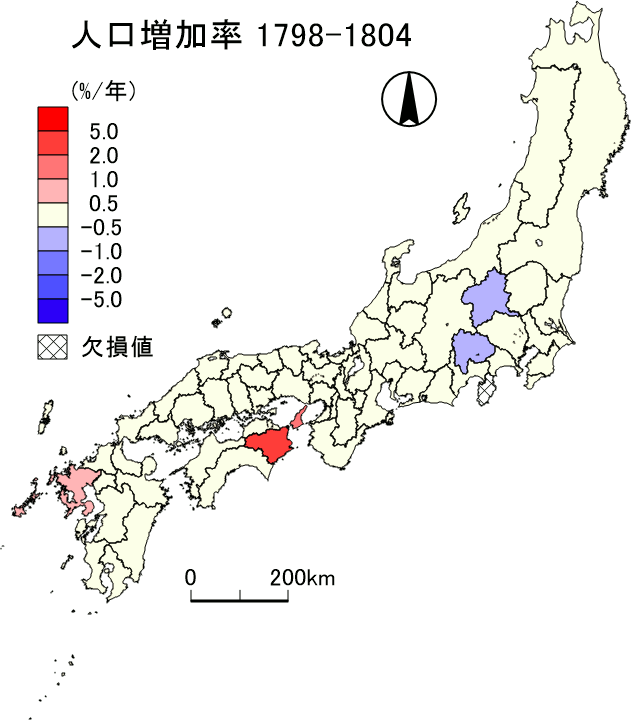
| 1804 | Bunka 1 |
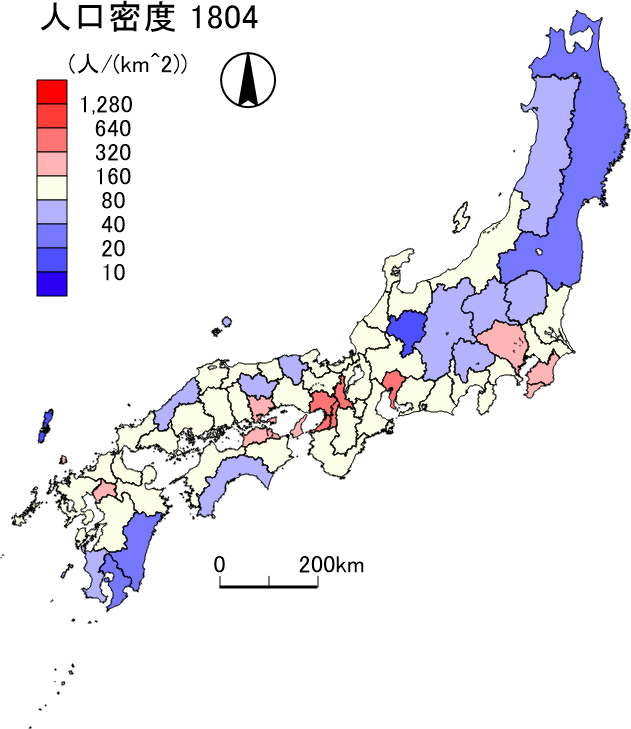 |
b | |
 |
|
| 1822 | Bunsei 5 |
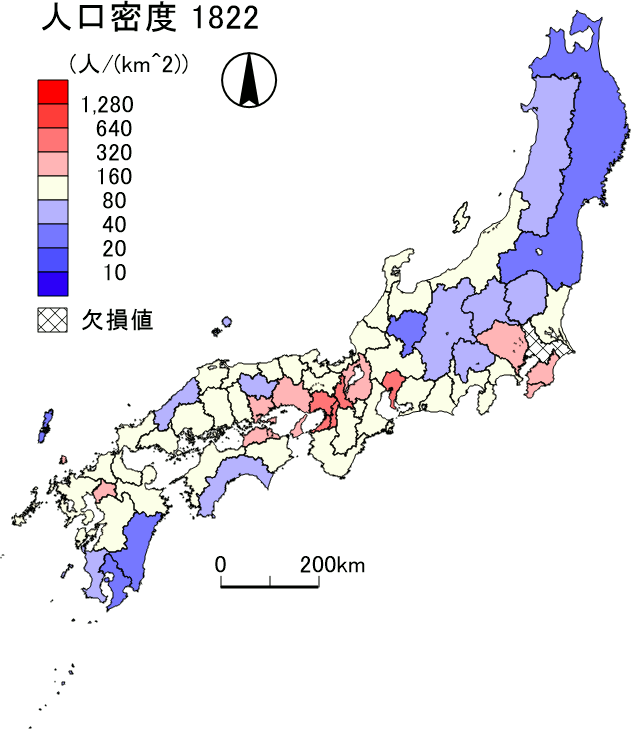 |
b | Excluded (too small): Shimôsa |
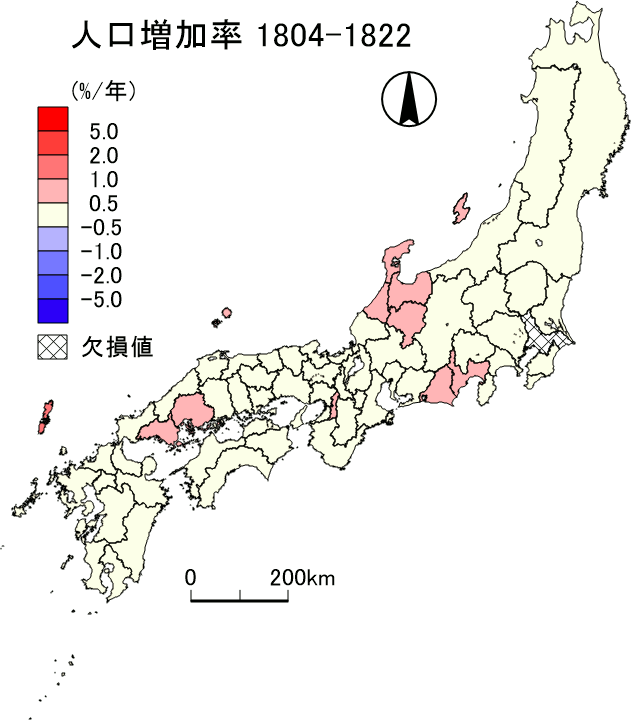 |
Possibly too large: Tôtômi, Suruga |
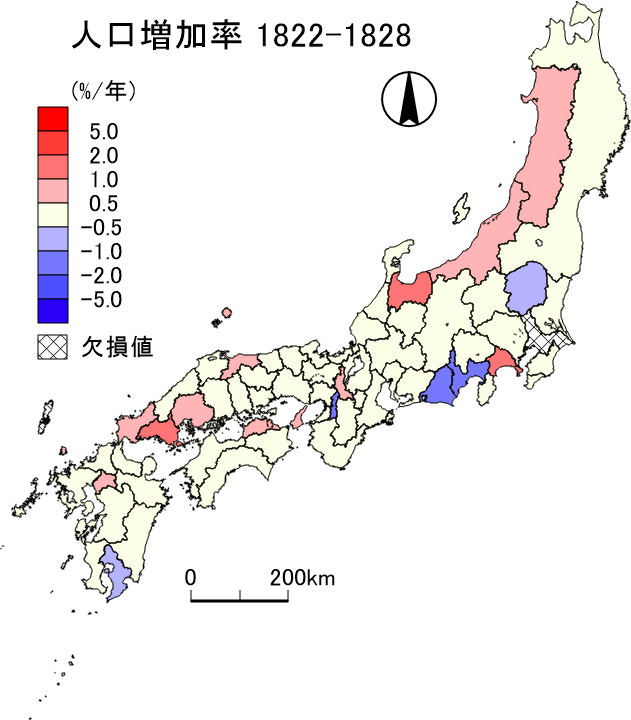
| 1828 | Bunsei 11 |
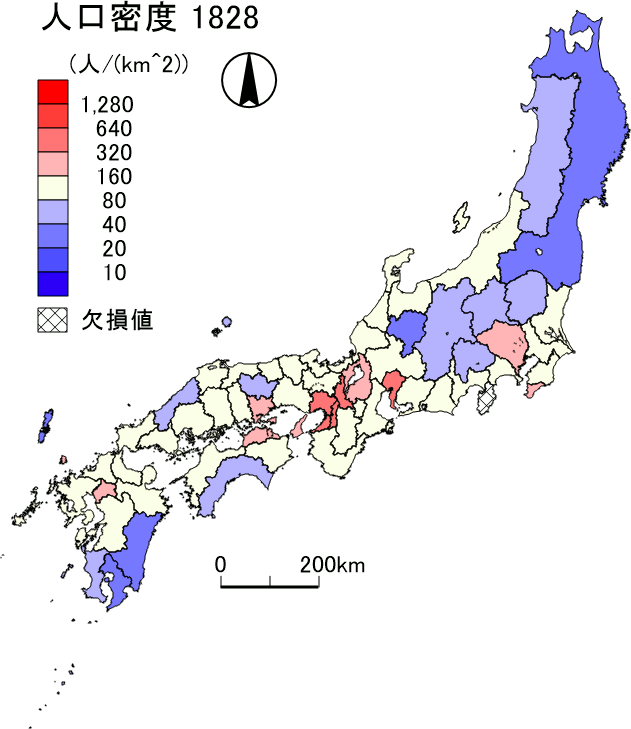 |
b | Excluded (too small): Tsushima
Corrected (too large): Kai |
 |
|
| 1834 | Tenpô 5 |
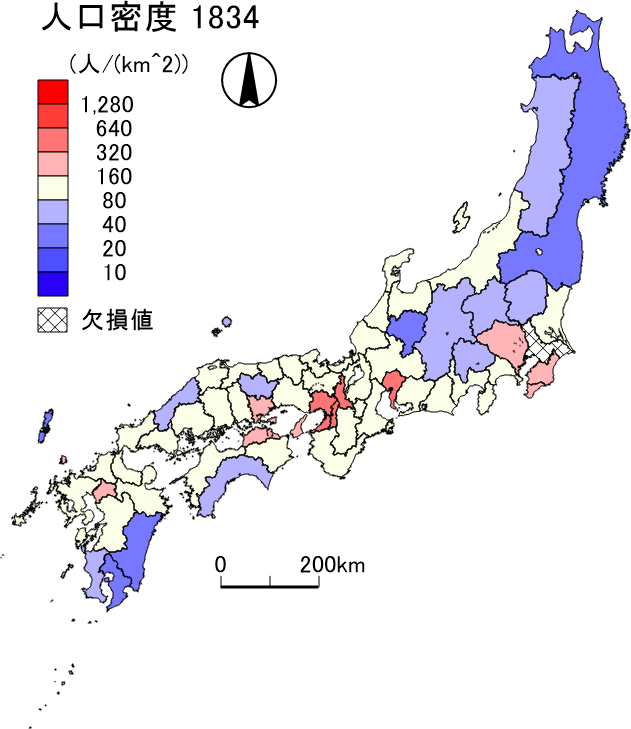 |
b | Excluded (too small): Shimôsa |
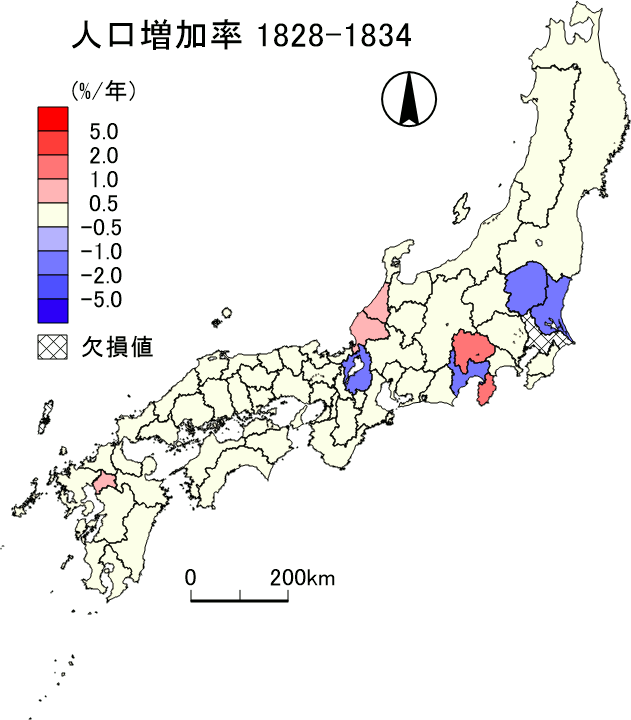 |
Likely too large: Izu, Echizen, Kai.
Likely too small: Shimotsuke, Hitachi, Suruga, Ômi |
| 1840 | Tenpô 11 |
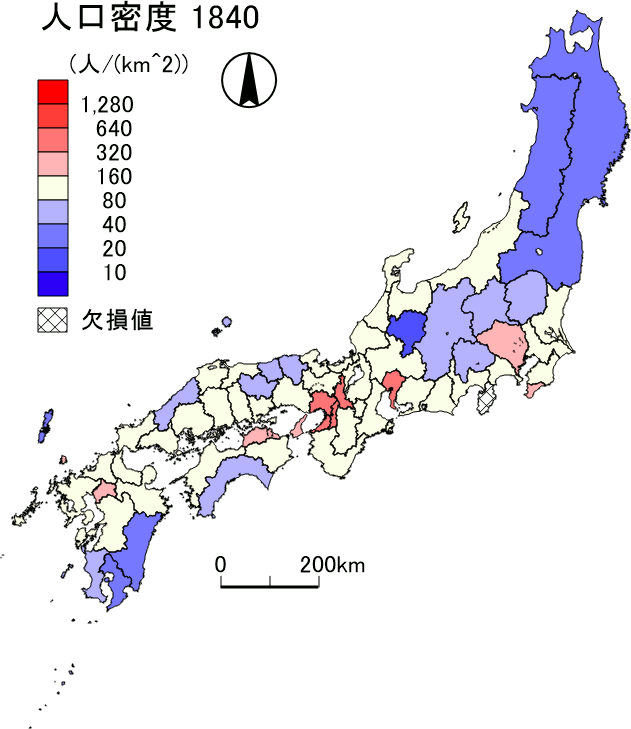 |
c | Excluded (too small): Izu |
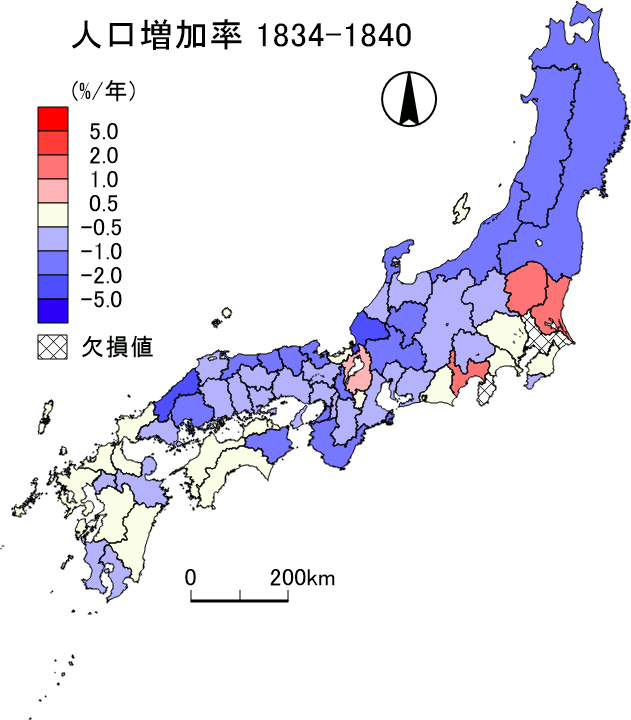 |
Likely too large: Shimotsuke, Hitachi, Suruga, Ômi |
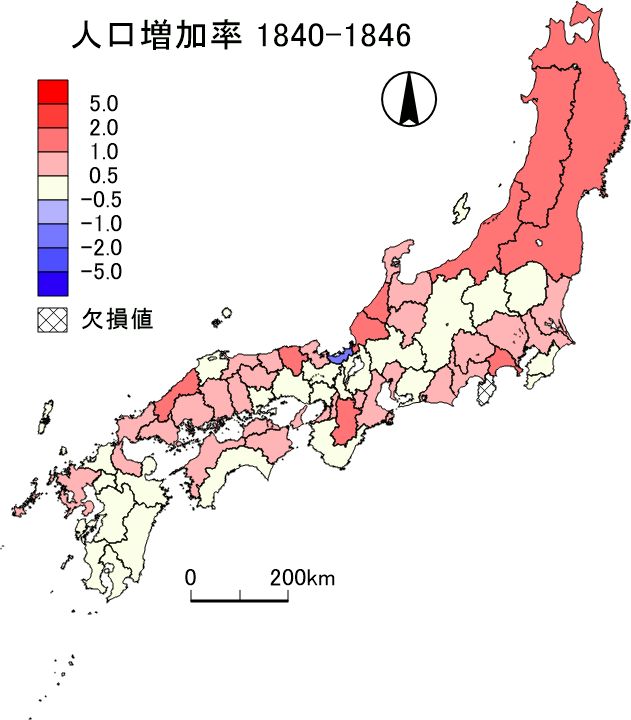
| 1846 | Kôka 3 |
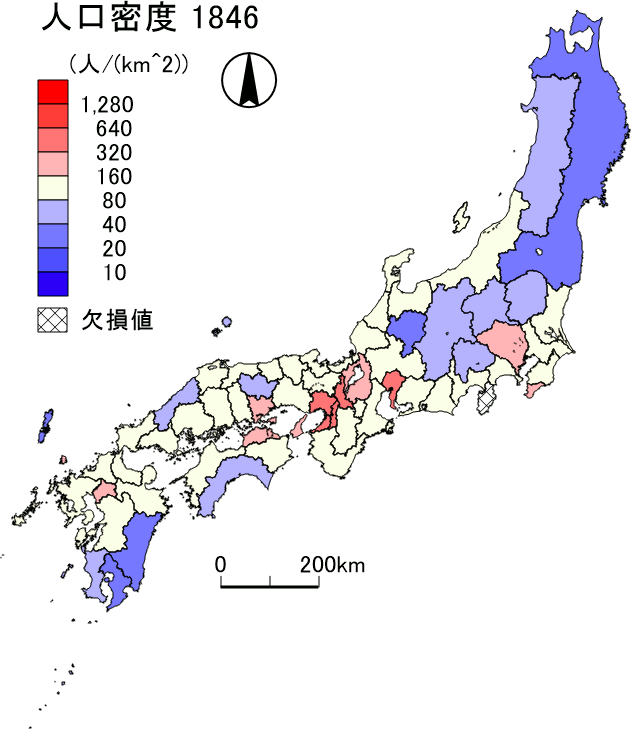 |
a | Excluded (too small): Izu |
 |
|
| 1872 | Meiji 5 |
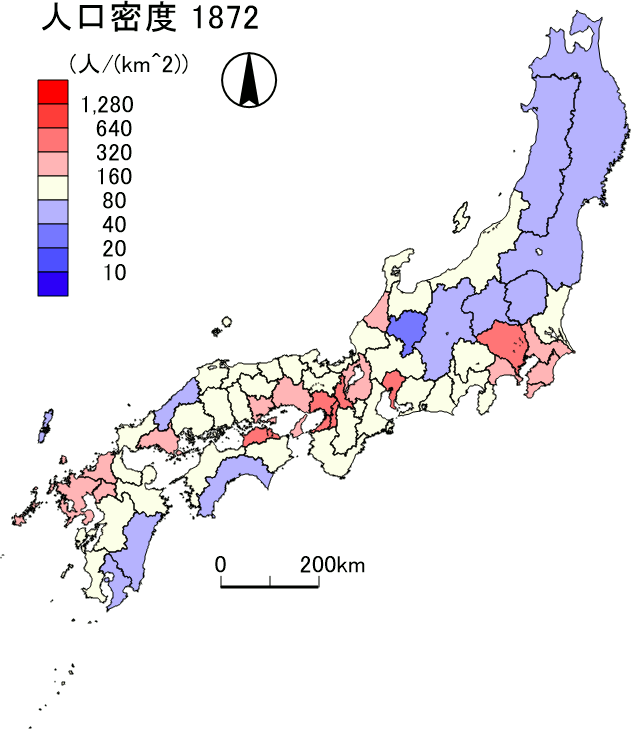 |
e | |
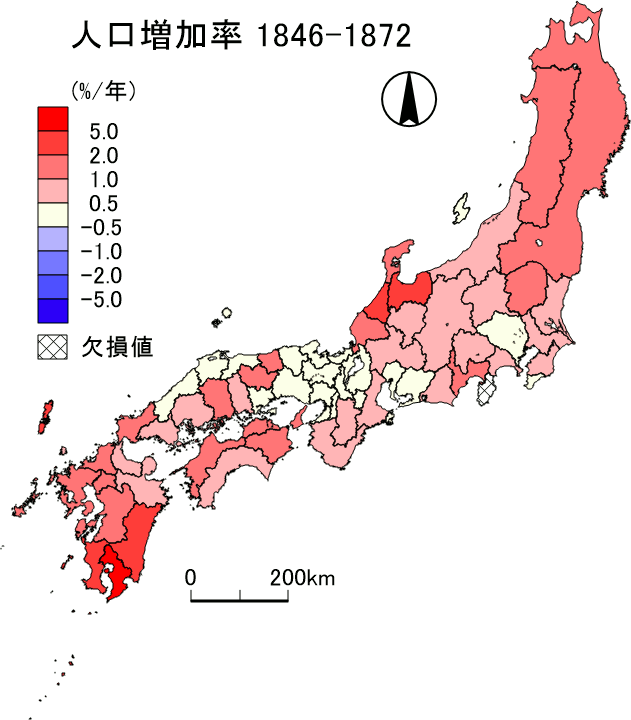 |
|
| (Part 2) Increase rate in combined time intervals |
| 1828 - 1840 | |
|
| |
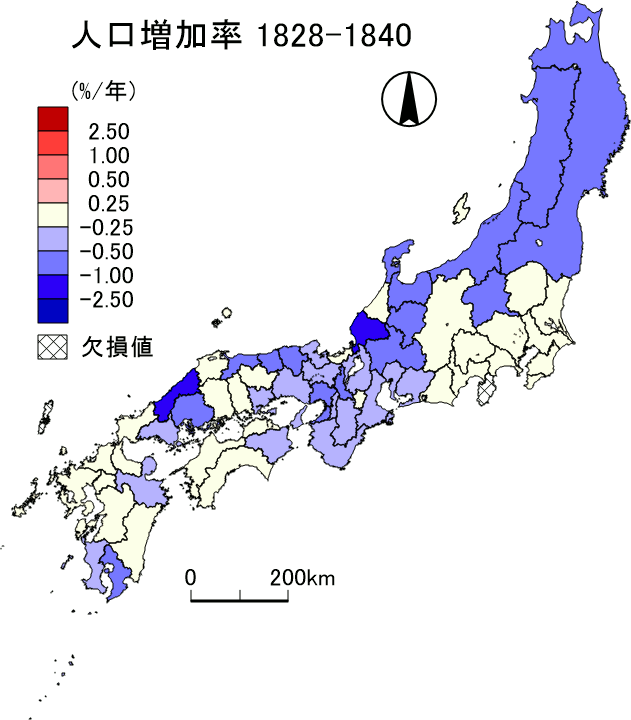 |
|
| 1721 - 1846 | |
|
| |
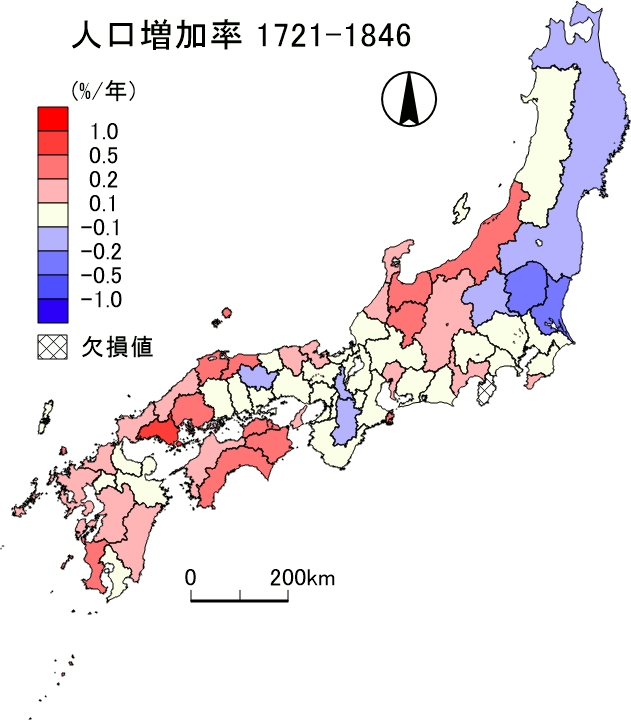 |
|
| 1721 - 1872 | |
|
| |
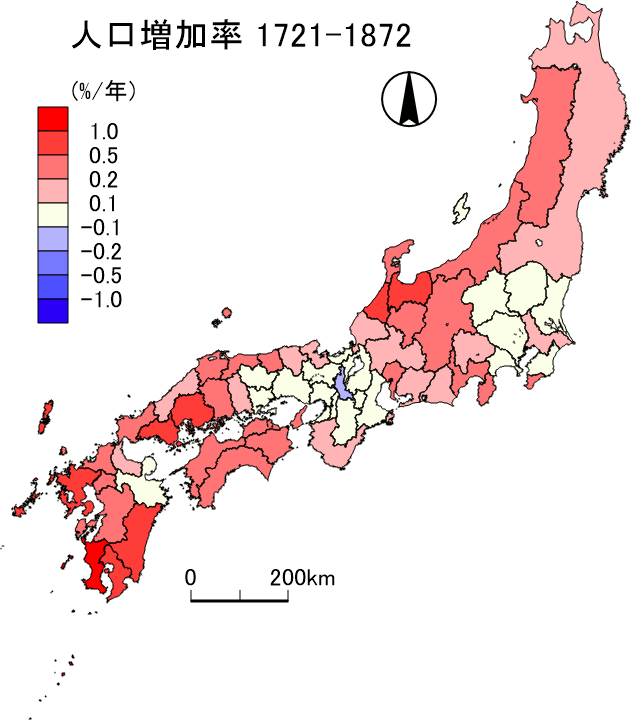 |
|
| (Part 3) Linear regression | ↓Intercept | | ↓Slope | ↓Increase rate by regression | |
1721 - 1846
(Rep. year 1800) |
|
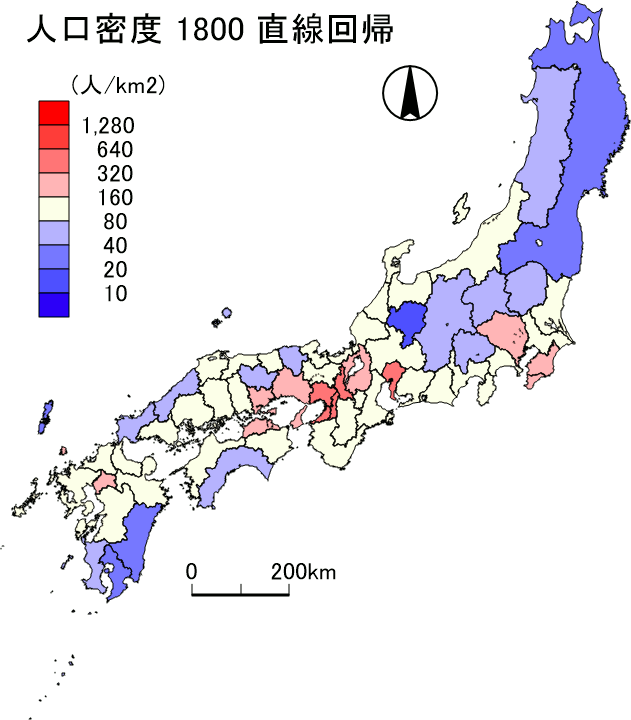 |
|
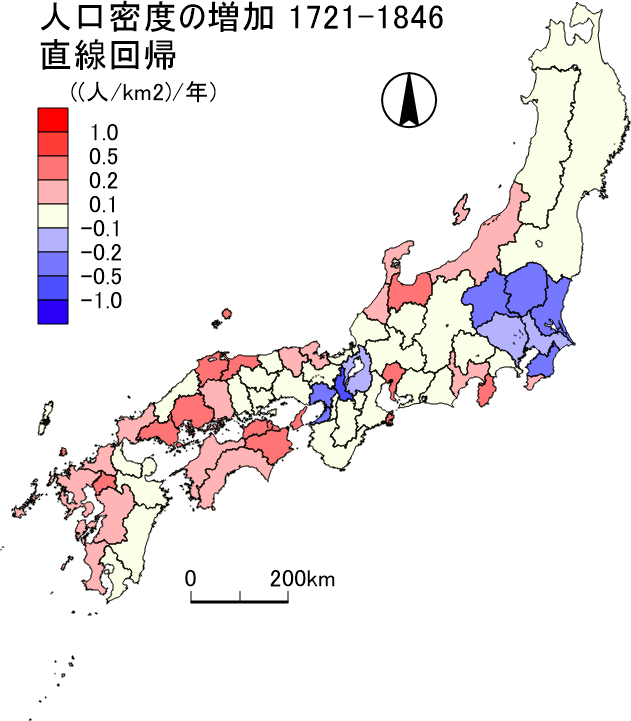 |
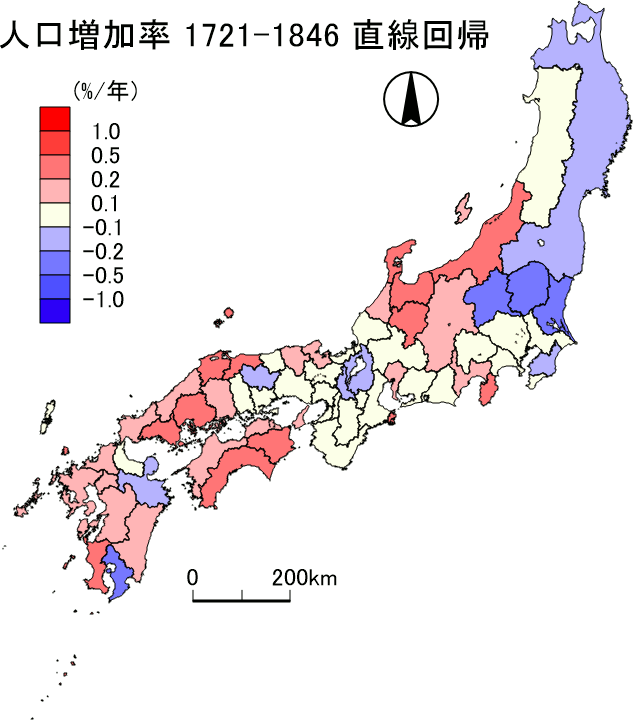 |
|
| (Part 4) Population density in the present era |
| 2015 | Heisei 27 |
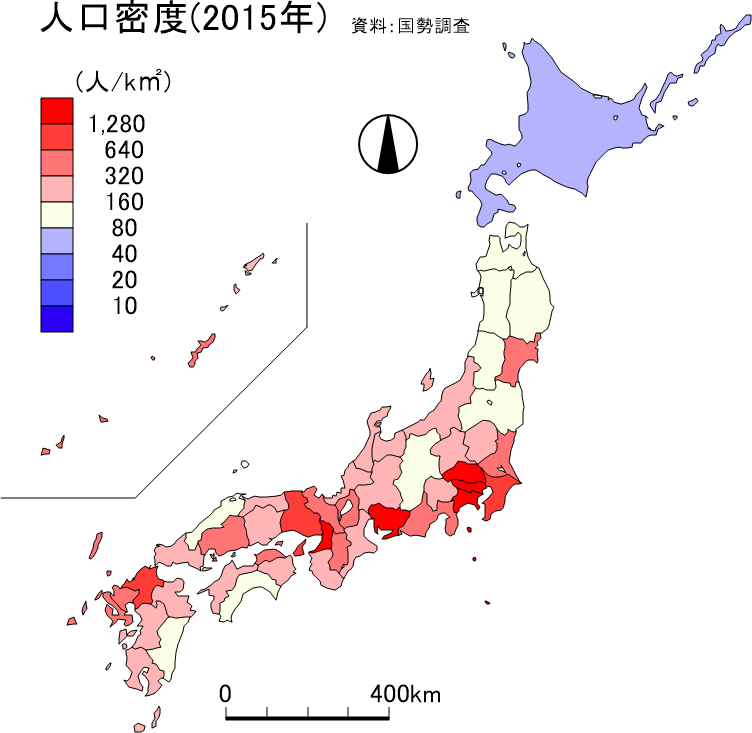 |
National Census | |
| |
Software used for mapping,
as well as calculation of areas of provinces and population density


