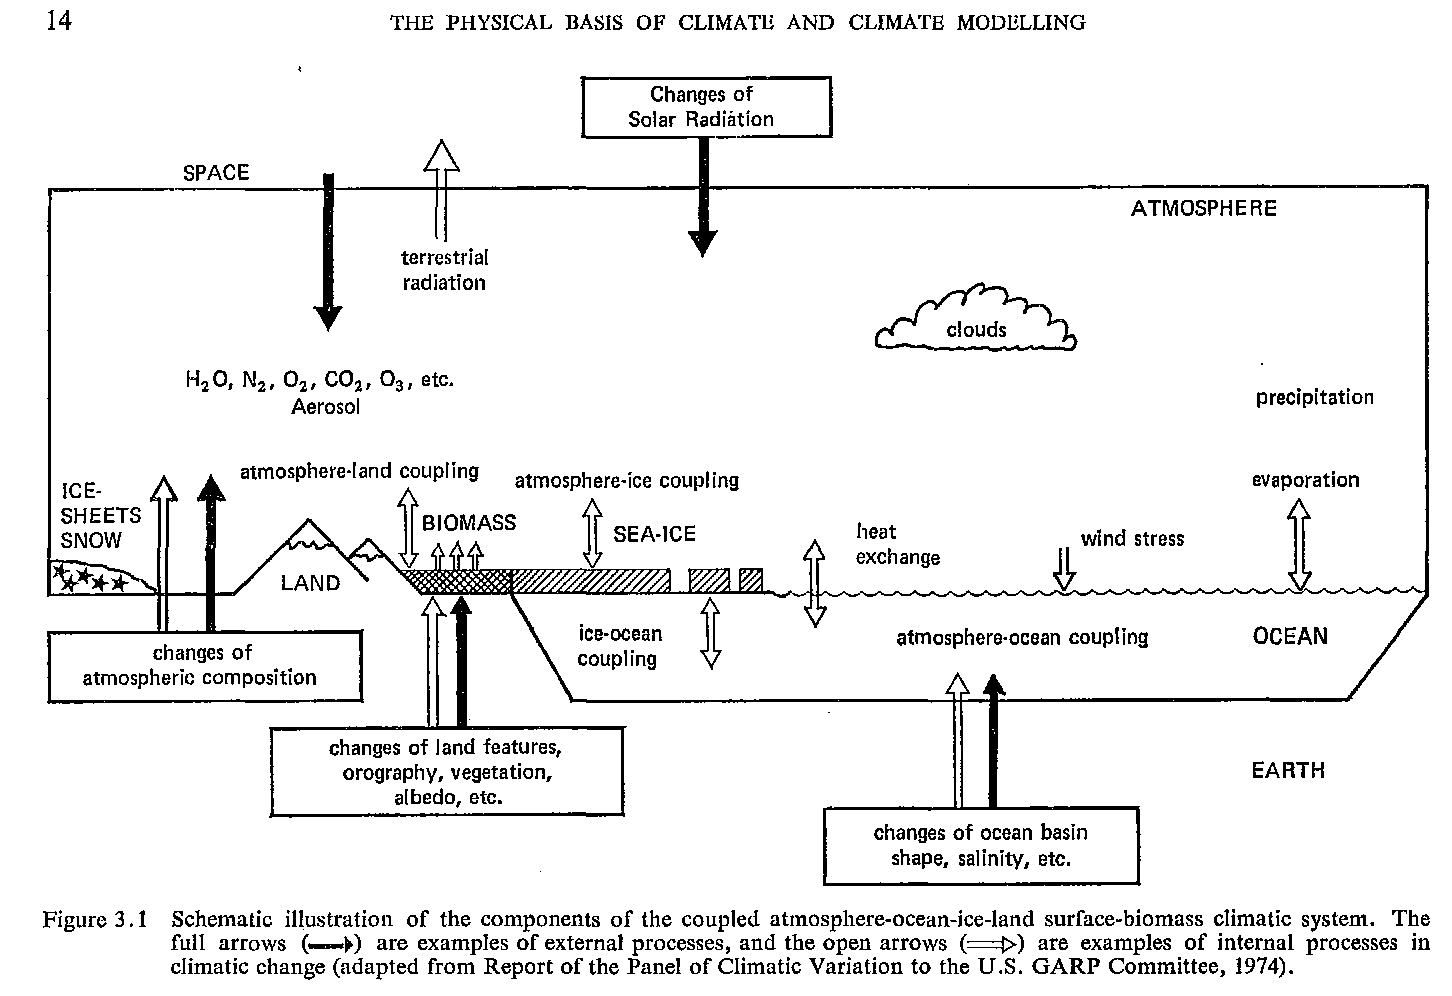

As a schematic diagram of the climate system, the one that was published in 1975 in the report of the U.S. Commitee for GARP "Understanding Climatic Change" is very well known. But, its revised version is published in the same year 1975 in the report of the ICSU-WMO Joint Organizing Commitee, that was responsible for promotion of GARP at the international level. The title of the book is "Physical Basis of Climate and Climate Modelling", and the diagram appears as its Figure 3.1 .
The climate system consists of subsystems "atmosphere", "ocean", "cryosphere", and "land surface". Subsystems exchange mass (of water), energy, and momentum, each other. The state of the system changes by external forcing, as well as by the internal interactions.
The figure in the report by the U. S. Commitee contained three subsystems (atmosphere, ocean and cryosphere). The figure in the international committee has "land surface" as well.
(Note that, in the figure, the subsystem "cryosphere" is shown as two components "ICE-SHEETS, SNOW" and "SEA ICE", and the subsystem "land surface" is shown as two components "LAND" and "BIOMASS". But, in the description of interactions, they are represented as "ice" and "land", respectively. So, I consider that the figure represents a system consists of 4 subsystems.)
(Incidentally, mountains capped by glaciers or snow is drawn near the character string "LAND". It seems misleading (unfortunately), because glaciers and snow should be considered as part of the cryosphere, rather than the land surface component. It may have been better to draw some component of terrestrial water such as lakes and rivers, and label "LAND" to it.)