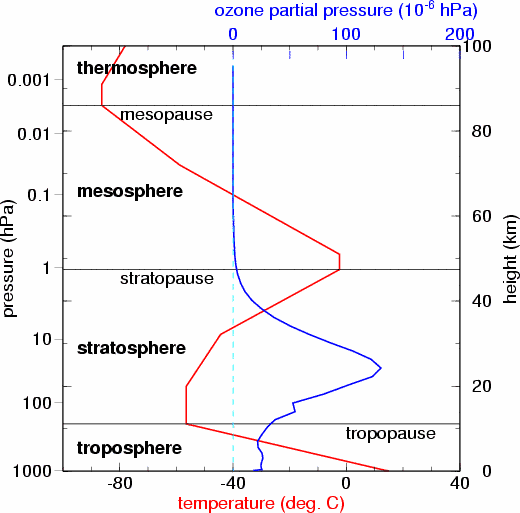
Fig. 4.1-1
Average vertical distribution of atmospheric temperature (red line, lower axis label, unit: degrees Celcius) and partial pressure of ozone (blue line, upper axis label,unit: 10-6 hPa).

The book of "Quaternary Science" includes a figure cited from Asakura et al. (1995). The figure here is drawn by Masuda.
The temperature curve is the U.S. Standard Atmosphere 1976, as cited by Kokuritsu Tenmondai (2003), p. 312-314.
The ozone curve is based on a digital data set "UGAMP Ozone Climatology" available from http://badc.nerc.ac.uk/. That is a global gridded data set for the 5-year period (1985-1989). Global, annual averages are calculated on pressure levels. Conversion from pressure levels to height levels are made according to U.S. Standard Atmosphere.