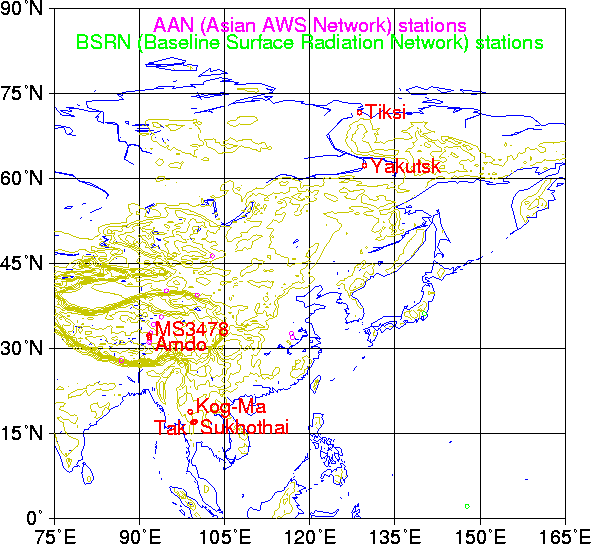
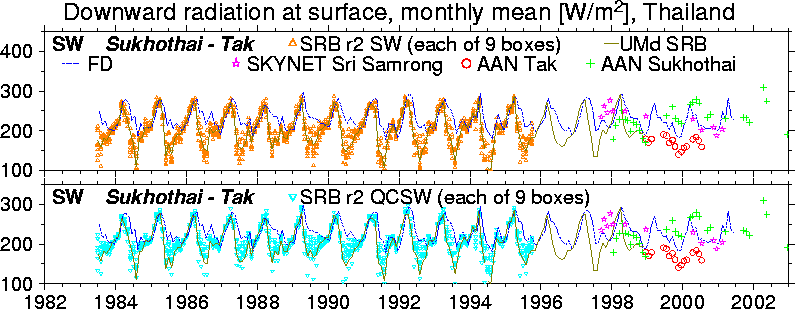
Note: The SKYNET station Sri Samrong would appear at the same place as the AAN station Sukhothai at this scale.
Draft, 7 April 2004, latest revision 5 July 2004 (To be presented at International Radiation Symposium 2004, Busan, Korea, August 2004)
Kooiti Masuda (Frontier Research Center for Global Change, Yokohama 236-0001, Japan; masuda @ jamstec.go.jp)
This is an interim report of one of ongoing activities for GAME WEBS (water and energy balance study).
Evaluation of global energy and water cycle requires global-scale products of energy fluxes at surface. Many components of the energy budget equation are not routinely observed. Thus, in order to achieve global coverage, we must use some indirect estimates by either remote sensing from satellites or numerical models. We can evaluate these products at those points where special observations of energy fluxes are performed. BSRN (Ohmura et al., 1998; http://bsrn.ethz.ch/) is a network of stations which observe radiative fluxes at surface with high precision continuously, to provide validation and calibration of global products. Unfortunately, there are few BSRN stations in Asia (though Japan has a station, Tateno). In the GAME project, AAN (http://www.suiri.tsukuba.ac.jp/Project/aan/aan.html) provides continuous monitoring of surface energy fluxes at various locations in Asia. Operations at some stations of AAN continue at present (as of April 2004) while some of them has been stopped. The precision of observations by AAN may not be so precise as BSRN, but still helpful for evaluating global products. In GAME, precise observations of radiation were also done, and the project continues as "SKYNET" (http://atmos.cr.chiba-u.ac.jp/aerosol/skynet/). Because of difficulty in maintenance of precision instruments, however, continuous operation of SKYNET stations started generally later than AAN. Therefore, I mainly use AAN observations in this report, and I also mention a case of GAME-Radiation/SKYNET station in Thailand and a case of BSRN station in Australia.


Note: The SKYNET station Sri Samrong would appear at the same place as
the AAN station Sukhothai at this scale.
Recently, NASA Langley Research Center released a dataset called "SRB (Surface Radiation Budget) Release 2" or "GEWEX SRB". (see http://eosweb.larc.nasa.gov/PRODOCS/srb/table_srb.html and http://srb-swlw.larc.nasa.gov/GEWEX_SRB_homepage.html). That is a data set of shortwave and longwave fluxes at surface covering July 1983 to October 1995 at 3 hour time interval and 1 degree latitude/longitude grid. There are two products for shortwave called "SW" (Pinker-Laszlo algorithm) and "QCSW" (Staylor algorithm), and two for longwave called "LW" (Fu-Liou algorithm) and "QCLW" (Gupta algorithm). All of them take information of cloud from ISCCP D Series data (actually DX data set; see Rossow and Schiffer 1999 and http://isccp.giss.nasa.gov/ for explanation of ISCCP data sets including D Series), and information of atmospheric temperature and humidity from an atmospheric reanalysis called GEOS-1 (http://daac.gsfc.nasa.gov/guides/GSFC/guide/dao_dataset.gd.html) done by NASA GMAO (formerly DAO; http://gmao.gsfc.nasa.gov/.)
This SRB Release 2 product is used as input in GSWP (Global Soil Wetness Project) Phase 2 (Dirmeyer et al., 2002; http://www.iges.org/gswp/). Downward fluxes of "SW" and "QCLW" during the period January 1986 - October 1995 were taken from SRB, and the fluxes for the remaining period (July 1982 - December 1985 and November-December 1995) were synthesized from forecast model output of NCEP Reanalysis 2 (Kanamitsu et al., 2002). It was designed to adjust the bias of the model output with respect to SRB (Zhao and Dirmeyer, 2003), but the adjustment unfortunately did not work as intended (compare the yellow curves in my plots with SW and QCLW).
SRB Release 2 is considered to supersede the previous version "SRB SW LW Monthly" (Gupta et al., 1999) which covers July 1983 - June 1991 at monthly time resolution and 250 km quasi-equal-area grid of ISCCP. For this previous product, information of clouds were taken from ISCCP C Series (actually C1), and temperature and humidity were from satellite soundings of TOVS. This data set was used for producing radiative input in GSWP Phase 1 (Dirmeyer et al., 1999).
On the other hand, the group at NASA GISS that produced ISCCP data set also produced a data set of radiative fluxes called "FD" utilizing ISCCP D Series (actually D1) data (see http://isccp.giss.nasa.gov/projects/flux.html). Information of air temperature and humidity were taken from TOVS soundings. The temporal coverage is July 1983 - June 2001 at 3 hour time interval, and the spatial resolution is about 250 km (quasi-equal-area grid of ISCCP).
For shortwave radiation, Pinker's group at the University of Maryland has produced a SRB product based on ISCCP D series (D1) data and the same algorithm as SRB Release 2 SW (see http://www.atmos.umd.edu/~srb/pathfinder/04ava-data.htm). This is referred to as "UMd SRB" in this report. Monthly data for July 1983 - August 1994 and daily data for July 1994 - December 1998 on 2.5 degree latitude/longitude grids are available on-line.
In this report, monthly mean downward shortwave and longwave fluxes are plotted and compared. It is unfortunate that the time frame of AAN and SKYNET does not overlap with that of SRB Release 2, which makes direct comparison difficult. But we can estimate interannual variability of fluxes if the duration of observations is sufficiently long, and we can discuss probable biases of climatological annual range. Also, the FD data set covers both time frames and it helps comparison.
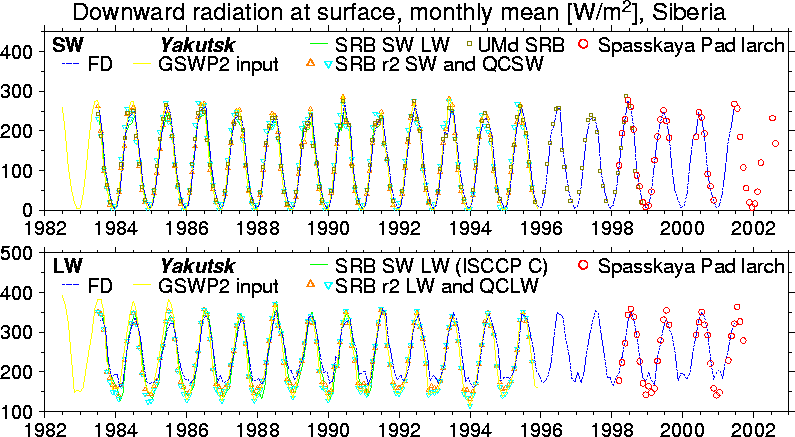
AAN has two major stations in Siberia.
One is Yakutsk, more precisely Spasskaya Pad (62.25 deg. N, 129.62 deg. E, about 210 m). Radiative fluxes are observed at 32 m above ground, above the canopy of larch (deciduous needle-leaf) forest. The FD grid box is 60 - 62.5 deg. N, 125.217 - 130.435 deg. E. The SRB grid box is 62 - 63 deg. N, 129 - 130 deg. E. The UMd SRB grid box is 60 - 62.5 deg. N, 127.5 - 130 deg. E.
Another is Tiksi (71.59 deg. N, 128.77 deg. E, 40 m). Fluxes are observed on a 10 m mast over Tundra. The FD grid box is 70 - 72.5 deg. N, 125.217 - 133.043 deg. E. The SRB grid box is 71 - 72 deg. N, 128 - 129 deg. E. The UMd SRB grid box is 70 - 72.5 deg. N, 127.5 - 130 deg. E.
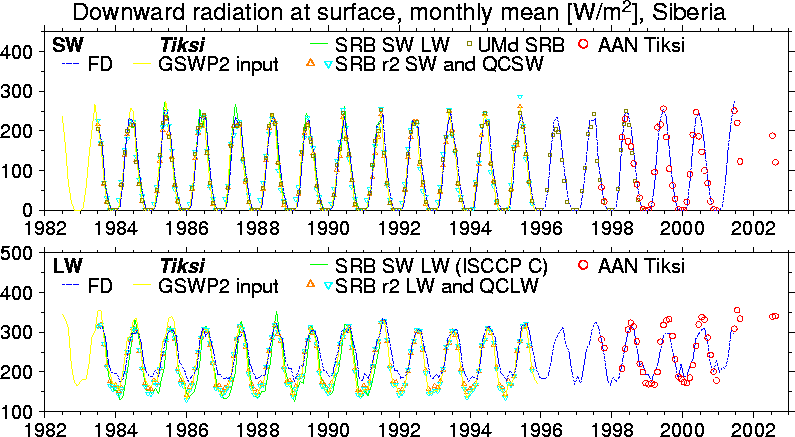
Agreement of downward shortwave radiation is good. Agreement of downward longwave radiation is good except in winter. At Yakutsk in winter, assuming that AAN observation is unbiased, FD overestimates downward longwave radiation. I suspect that the temperature profile used for production of FD (based on TOVS) did not capture strong temperature inversion in eastern Siberia. (The bias in downward radiation is mostly cancelled by a similar bias in upward radiation [not shown here], so that the net longwave radiation is not seriously biased.) At Tiksi, the difference between FD and SRB is similar to the case of Yakutsk, but AAN comes in between.
In the Tibetan Plateau, the AAN station that has longest continuous records is Amdo (32.24 deg. N, 91.63 deg. E, about 4700 m above sea level). The landscape is flat grassland. The FD grid box is 30 - 32.5 deg. N, 90.732 - 93.659 deg. E. The SRB grid box is 32 - 33 deg. N, 91 - 92 deg. E. The UMd SRB grid box is 30 - 32.5 deg. N, 90 - 92.5 deg. E. Another AAN station "MS4378 NPAM" (31.93 deg. N, 91.72 deg. E, 5063 m) is shown together, though observation here was conducted only in summer of 1998.
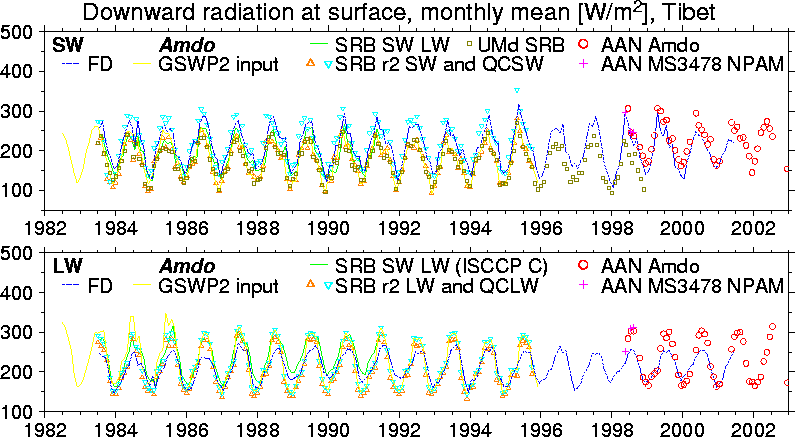
For downward shortwave radiation, SRB SW and UMd SRB underestimates the flux by about 50 W/m2 throughout the year while SRB QCSW seems to be not biased (though it sometimes takes erratic values). FD shows somewhat smaller values than AAN (with difference about 20 W/m2), but it is difficult to tell whether this is a significant difference.
For downward longwave radiation, FD clearly underestimates the flux in summer (June to August) assuming that AAN is unbiased. I suspect that the temperature profile used for production of FD did not capture daytime warmth of the ground on the plateau. SRB products (both LW and QCLW) have similar levels as AAN in summer. In winter, FD agrees with AAN during the period where both exist. The winter level of both SRB products seems to be lower than AAN, but FD also comes near the level in some years. So it is difficult to tell whether this difference is a bias of SRB or real interannual variability.
Comparison is made for two regions, Chiang Mai region and Sukhothai - Tak region.
The AAN station in the Chiang Mai region is Kog-Ma (18.81 deg. N, 98.90 deg. E, 1290 m above sea level). Radiative fluxes are observed at 50.5 m (43.4 m for upward shortwave) above ground, above the canopy of evergreen forest. The FD grid box is 17.5 - 20 deg. N, 97.941 - 100.588 deg. E. The SRB grid box is 18 - 19 deg. N, 98 - 99 deg. E. The UMd SRB grid box is 17.5 - 20 deg. N, 97.5 - 100 deg. E. Also, downward shortwave radiation observed at an agrometeorological station at Mae Cho near Chiang Mai (18.92 deg. N, 99.00 deg. E), as part of GAME-Tropics (http://hydro.iis.u-tokyo.ac.jp/GAME-T/GAIN-T/field/radiation-agromet/), is included in the comparison. The data at the agromet station are available for years 1998 and 1999.
The AAN stations in the Sukhothai - Tak region are Sukhothai paddy site (17.07 deg. N, 99.71 deg. E) and Tak tower (16.94 deg. N, 99.43 deg. E, 121 m). The GAME-Radiation/SKYNET station is Sri Samrong (17.17 deg. N, 99.87 deg. E). The FD grid box is 15 - 17.5 deg. N, 99.130 - 101.739 deg. E. The SRB grid box is 17 - 18 deg. N, 99 - 100 deg. E. The UMd SRB grid box is 15 - 17.5 deg. N, 97.5 - 100 deg. E. The land cover of Tak site is mixture of rice paddy, shrubs and deciduous stands. Sukhothai site is in rice paddy. Among radiative fluxes, only downward shortwave and net radiation are observed there. Sri Samrong is in an agricultural experiment station and the land cover consists of various upland crop fields. Downward radiation is observed at the flat roof of a house and upward radiation is observed over grass. Downward shortwave radiation at Sri Samrong is calculated from observations of direct and diffuse radiation.
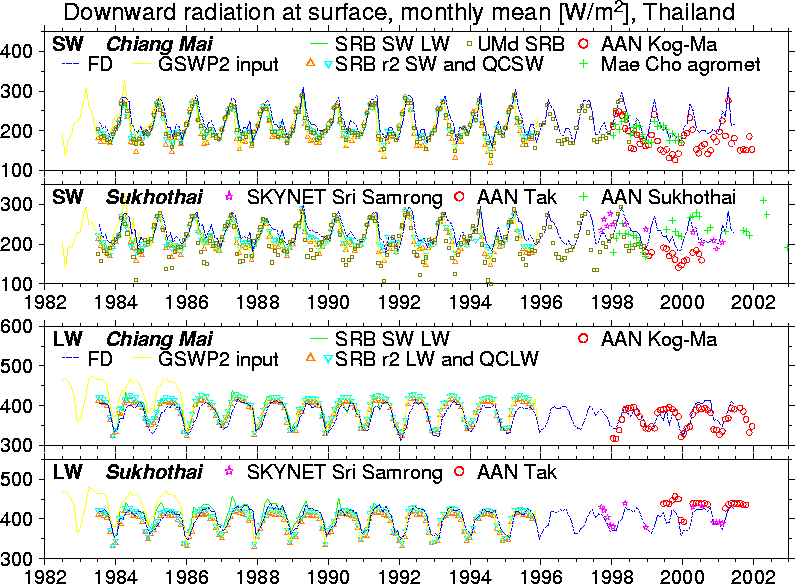
For downward shortwave radiation, there is also considerable difference between surface observations, and it is difficult to discuss which data are less biased. Among the satellite data, SRB SW and QCSW take values generally similar to FD. But, in rainy season, SRB SW and UMd SRB occasionally (but not always) takes values considerably lower than SRB QCSW and FD.
In addition, the above figure shows that UMd SRB sometimes takes values lower than SRB SW in the Sukhothai - Tak region. This difference mainly comes from the difference of the grid size, and the characteristics of the two data sets can be considered similar, as expected from the fact that they use the same algorithm. In the figure at the end of the section on Thailand, values of SRB SW (also QCSW) at each of the nine 1-degree boxes which reside between 15 deg. N and 18 deg. N, between 97 deg. E and 100 deg. E are plotted. The values of UMd SRB comes in the middle of the spread of SRB SW. The values of SRB QCSW also have large spread in the rainy season, but they become lower than UMd SRB much less often than SRB SW.
In Chiang Mai region, Kog-Ma AAN shows almost always smaller value than FD, often by 50 W/m2. Mae Cho Agromet station show values closer to FD, but it also shows smaller values than FD in late dry (hot) seasons of March-April. I suspect that the cause of difference among surface observations is regional inhomogeneity of cloudiness. There is approximately 1000 m difference of surface elevation between Kog-Ma and Mae Cho, and it is very likely that clouds often cover mountains but not plains. The comparison may suggest that FD data correspond to the situation in plain areas and that SRB data represent more of the situation in mountain areas, but it cannot be said decisively.
In Sukhothai - Tak region, all observation sites are in plains, and the systematic difference between them is difficult to explain by natural causes. I rather suspect that some of them have problems in maintenance of the radiometer. Observations at Sri Samrong in 2000 - 2001, though intermittent, agree with FD very well. Though not conclusive, it may be assumed for this period that calibration at this station (generally better maintained than AAN stations) is good, FD is not biased, and observations at Sukhothai and Tak are respectively biased towards higher and lower values. Actually, the reported nighttime level of downward shortwave radiation at Tak becomes significantly negative from 16 August 2000, and I excluded data of this period. It is suspected that the calibration went wrong some time before that. However, this evaluation of quality of observation may not be applicable to earlier periods. Agreements between Sri Samrong and FD is not good in month-to-month basis during 1997 - 1998, though the average level seems similar. On the other hand, FD agrees with Sukhothai for the latter half of year 1998, and with Tak in late 1998 / early 1999. It may be suggested that in this period the representativeness of FD was again good and maintenance of the instrument was then better at Sukhothai and Tak than Sri Samrong, but it is not certain.
Downward longwave radiation by FD and SRB generally agrees with Kog-Ma AAN, Tak AAN and Sri Samrong SKYNET observations, except that in Sukhothai - Tak region in the season of lower values (around Jaunuary) SRB LW and QCLW tend to take smaller values than FD and surface observations. It seems that there is no serious problem of calibration in the longwave radiometer at Tak despite of questionable situation of the shortwave radiometer.
In the season of higher values (May to September), in the Chiang Mai region, SRB data show somewhat higher values than FD and Kog-Ma. In the Sukhothai - Tak region, values at both Sri Samrong and Tak are somewhat (ca. 25 W / m2) higher than FD, but here SRB shows generally similar and occasionally lower values than FD. Considering that Kog-Ma is a mountain site and the grid box also contains plain areas, it may be considered that that FD is somewhat biased towards lower values, and SRB data better represent the areal average of Chiang Mai region but they also are biased towards lower values in Sukhothai - Tak region. This is not a conclusion but just a possibility. In addition, when looked month-to-month, FD has occasional "troughs" (such as in July 1998 in Chiang Mai and August 1999 in both regions) which do not appear in AAN.
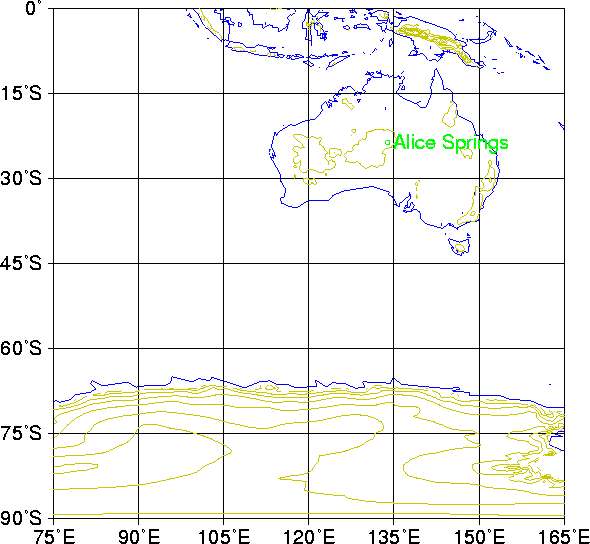
Australia has a BSRN station at Alice Springs (23.70 deg. S, 133.87 deg. E, 547 m), operated by Australian Bureau of Meteorology. 1-minute flux data are obtained from the BSRN data center (http://bsrn.ethz.ch/) and monthly averages are computed. The FD grid box is 22.5 - 25 deg. S, 133.636 - 136.364 deg. E. The SRB grid box is 23 - 24 deg. S, 133 - 134 deg. E. The UMd SRB grid box is 22.5 - 25 deg. S, 132.5 - 135 deg. E.
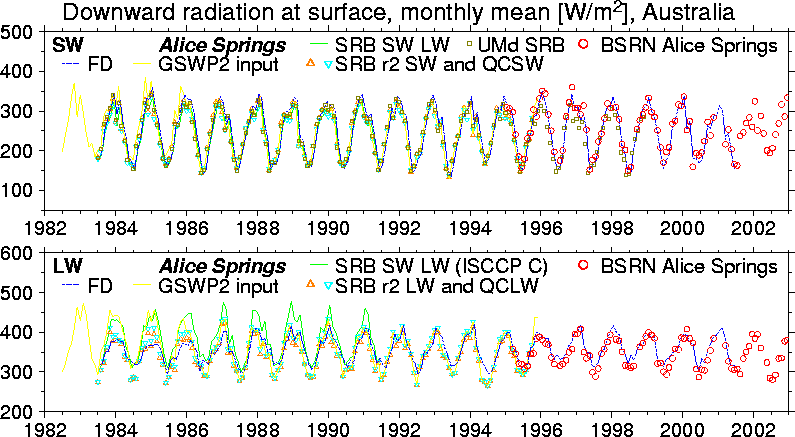
Agreement between satellite products (SRB Release 2, FD and UMd SRB) and BSRN is generally very good. Winter (around July) level of downward longwave fluxes according to two versions of SRB Release 2 is lower than FD and maybe lower than BSRN. In summer (around January), older "SRB SW LW Monthly" data set has considerable bias toward higher values in downward longwave radiation, but Release 2 products are improved in this respect.