Water balance of the Mekong river basin during GAME IOP


Kooiti MASUDA (Frontier Research System for Global Change)
diagram.png

[up][page 1][>page 2]

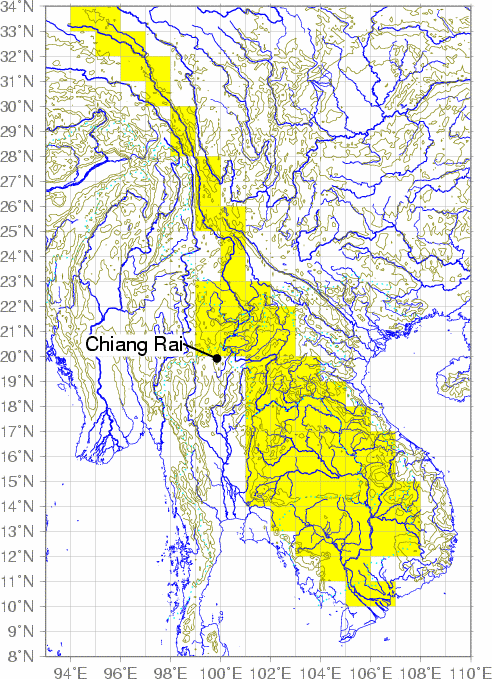
Mekong river basin (in 1-degree latitude-longitude grids)


mapx1.png

[page 1<][page 2][>page 3]

Estimated discharge to the ocean (cubic km / year)

Values from

1Amazon6642
2Congo1308
3Orinoco1129
4Changjiang944
5Brahmaputra628
6Mississippi610
7Yenisey599
8Parana568
9Lena531
10Mekong525
11Tocantins511
12Tapajos415Tributary of Amazon, but measured separately
13Ob412
14Ganges404
15Irrawaddy393
[page 2<][page 3][>page 4]

Sources of data for water balance of Year 1998

[page 3<][page 4][>page 5]

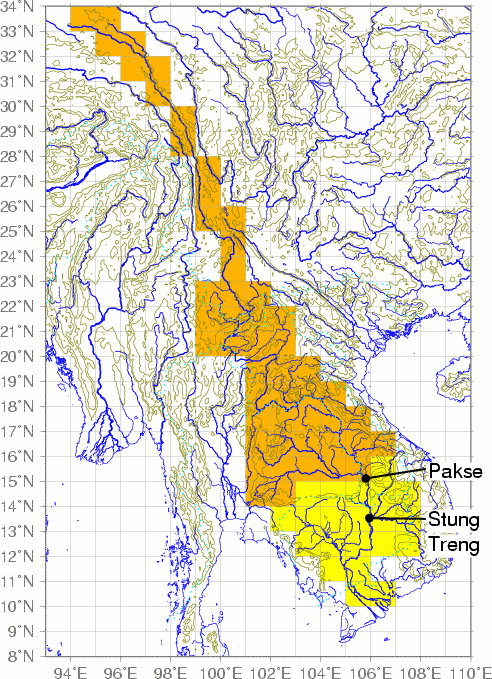
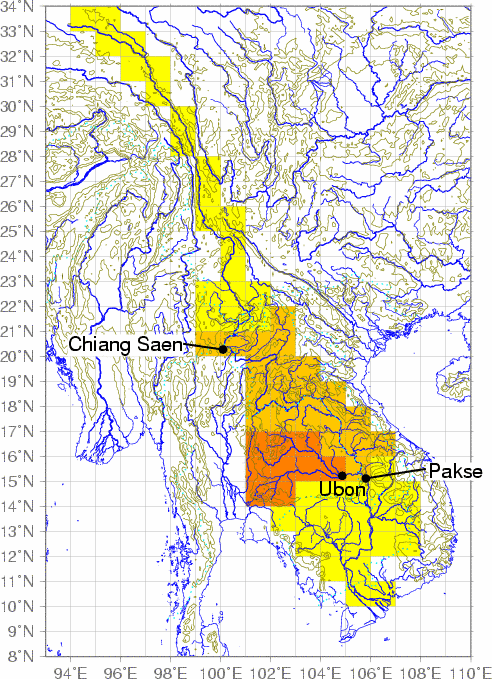
Mekong river basin [Orange: area of water balance study]


mapx.png

[page 4<][page 5][>page 6]

Rain gauge observations (Year 1998)

[page 5<][page 6][>page 7]

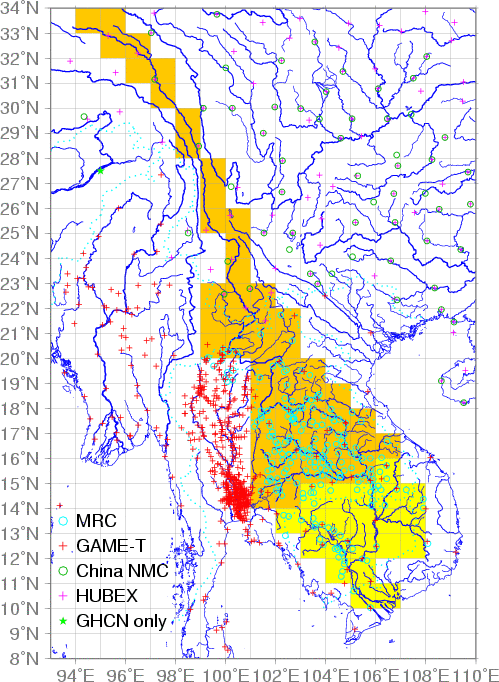
Stations of rain gauges (July 1998)


mapprcst.png

[page 6<][page 7][>page 8]

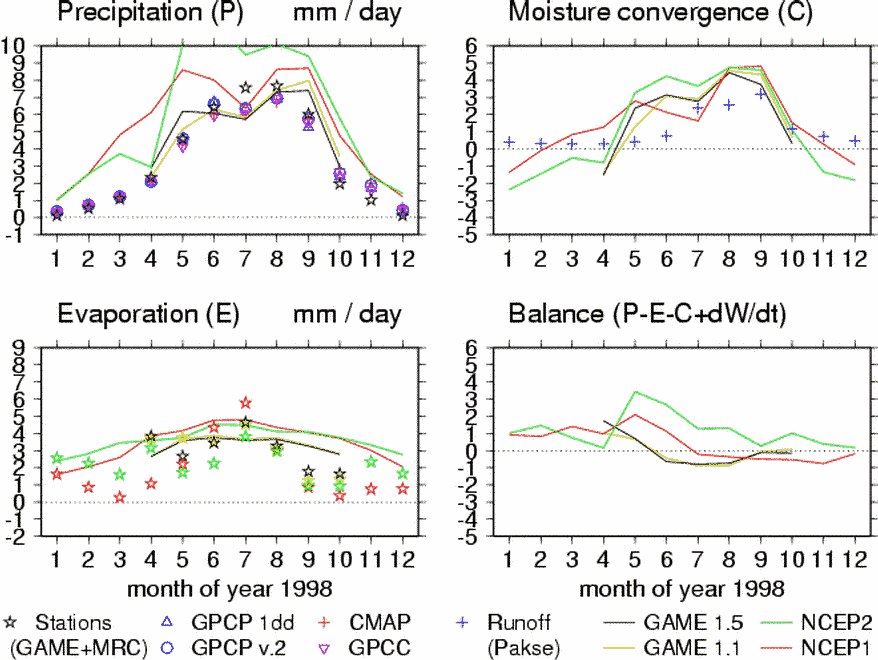
Water balance fluxes, basin average above Pakse, 1998


wbgraph.png

[page 7<][page 8][>page 9]

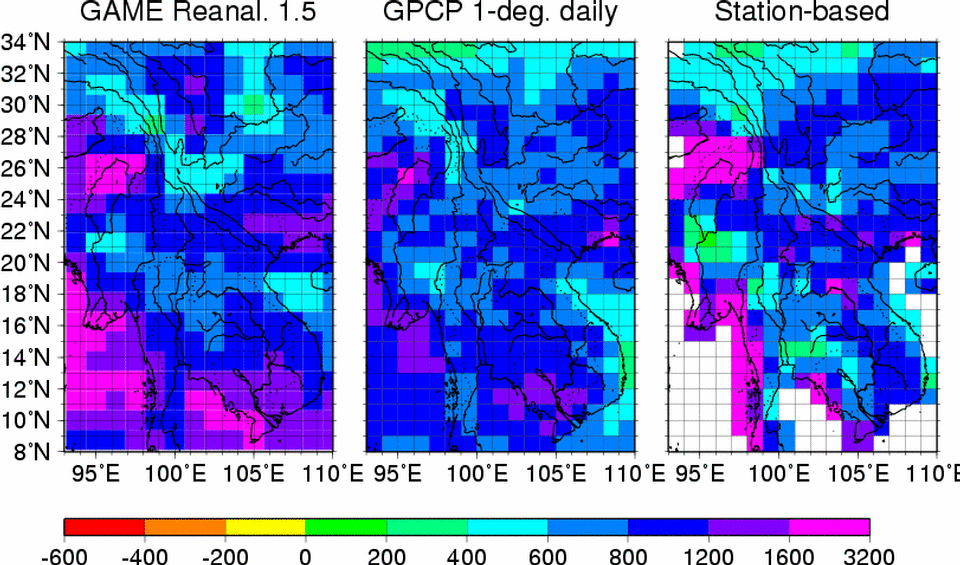
Precipitation (May - August 1998) [mm / 4 months]


pmjja.png

[page 8<][page 9][>page 10]

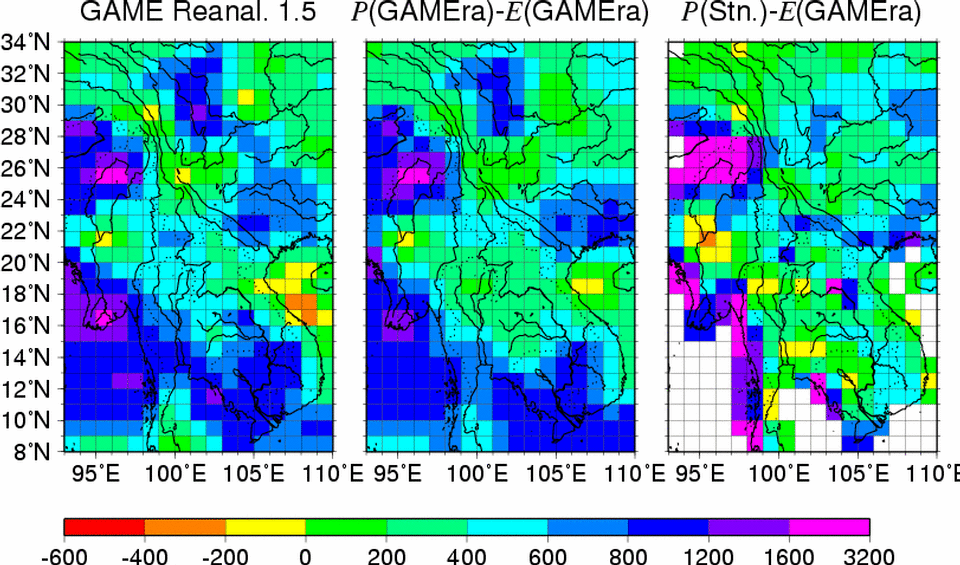
Evaporation (May - August 1998) [mm / 4 months]


emjja.png

[page 9<][page 10][>page 11]

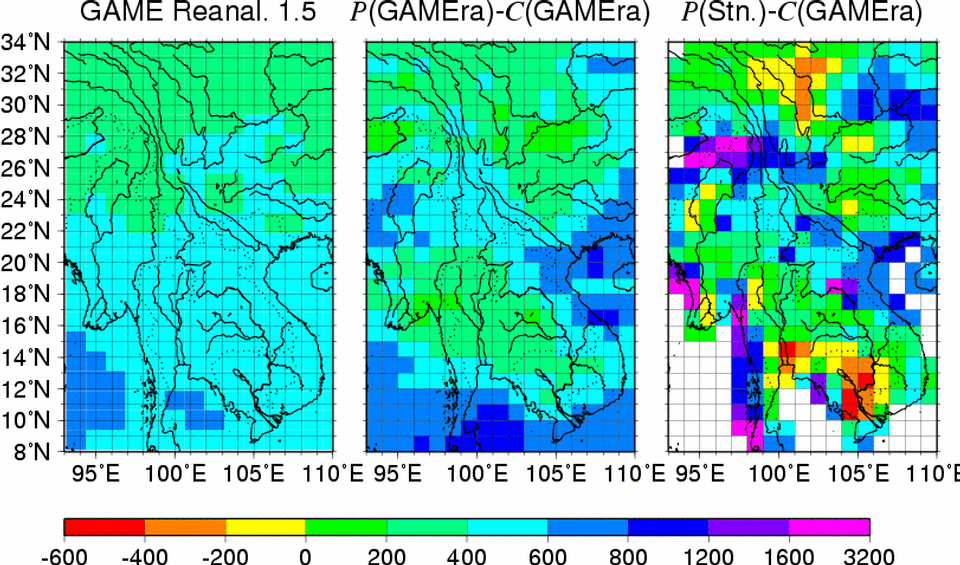
moisture Convergence (May - August 1998) [mm / 4 months]


cmjja.png

[page 10<][page 11][>page 12]

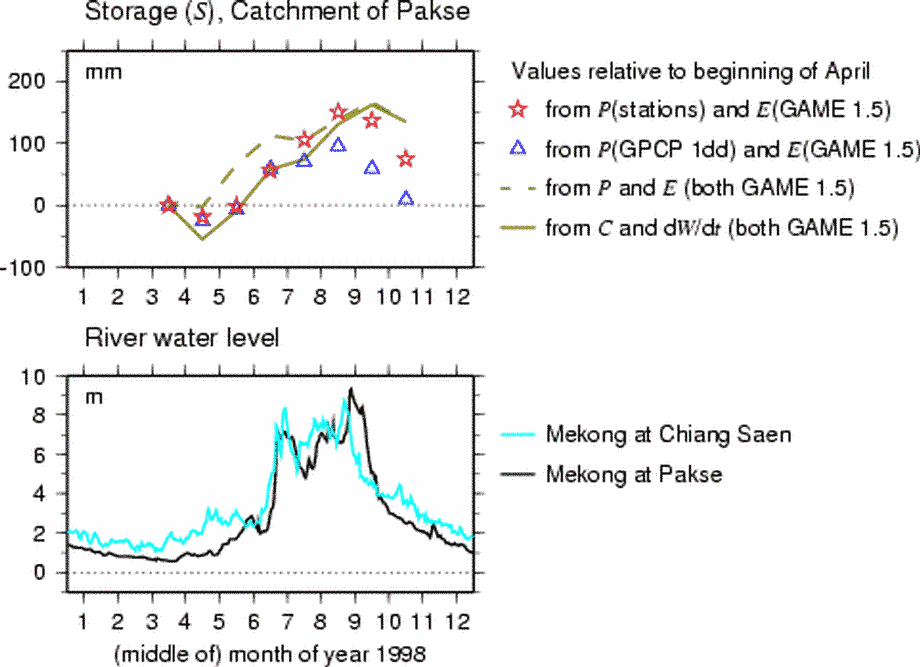
terrestrial water Storage, basin average (April - October 1998)


storage.png

[page 11<][page 12][>page 13]

Plan for revised analysis (middle Mekong and Nam Mun)


mapx4.png

[page 12<][page 13][>page 14]

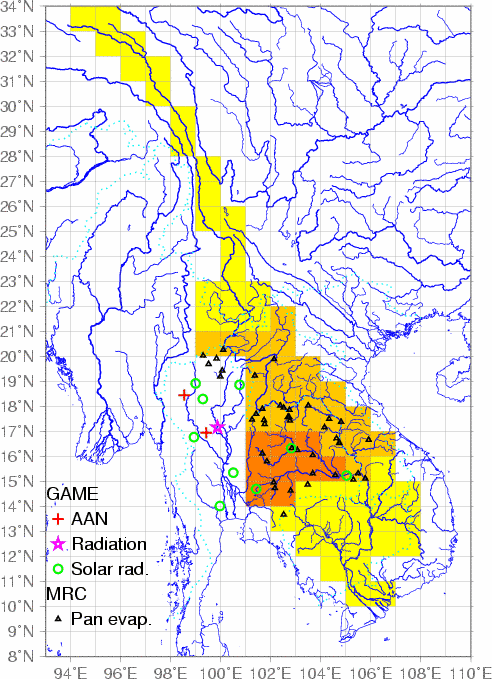
Stations of surface flux observations (1998)


mapflxst.png

[page 13<][page 14][>page 15]

Stations of radiosonde observations (1998)


mapsonde.png

[page 14<][page 15][up]